Break-even analysis and marginal analysis
- Agnes Sopel

- Apr 2, 2023
- 9 min read

What relevance has cost when making management decision? We know that not all costs may be relevant to it. We must, therefore, separate those costs that are relevant or not. We also need to understand how cost behaves in changes in activities to assess risks.
Cost represents the amount sacrificed to achieve a particular business objective.
Opportunity cost is the value of the opportunity forgone in other to pursue the other actions.
When making decisions we are to consider the opportunity costs as well as the historic costs.
Opportunity costs are rarely taken into consideration in financial accounting as they do not involve any out-of-pocket expenditure. But historic costs involve out-of-pocket expenditure and they are used in preparing historic financial statements.
However, when making decisions about the future, historic costs may not be relevant. It is the future opportunity costs and future outlay costs ( future amounts spent to achieve the objectives) are of concern.
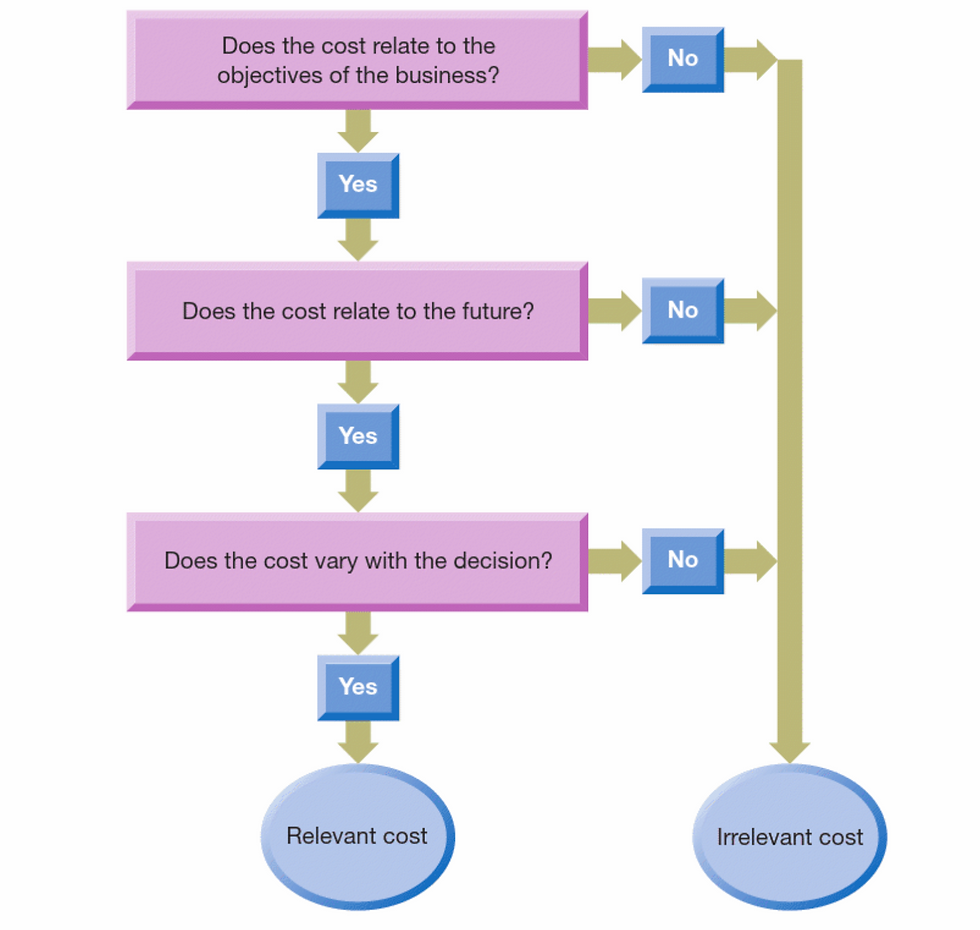
To be relevant to particular decision a cost should meet the following criteria:
* It must relate to the objectives of the business - meaning it must relate to the business wealth objectives;
* It must be a future cost - past costs cannot be relevant to the decisions made about the future;
* It must vary with the decision - only costs that differ between outcomes are relevant.
Atrill P. (2018) provides one useful flow chart to determine which costs are relevant to to a decision.
Cost behaviour
We know that cost represents the resources sacrificed to achieve benefits. Cost also can be classified as fixed costs and variable costs.
Fixed cost means that the cost is unaffected by changes or volumes of an activity. They are, however, impacted by inflation. There are also stepped fixed costs identified when the costs increase as the volume or activity increase. For example, higher rent for new larger premises needed.
Variable costs vary with the volume of activity, for example, costs of raw materials.
In some cases costs may have combined elements of fixed and variable costs. These are described as semi-fixed (or semi-variable) costs. For example electricity or lightning will increase as part of increased activity.
The break-even point
If we know how much of each of the elements of costs represents it is possible to make predictions of the total "per unit" cost. This can be represented in the graph below.
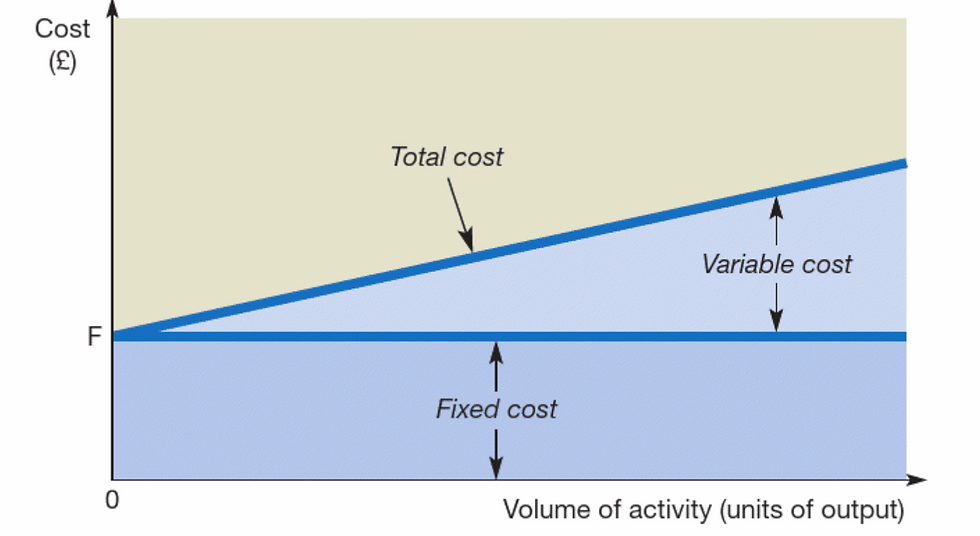
If we know the fixed and variable costs per unit we can determine a total cost over the possible range of activity. The bottom part of the chart represents the fixed cost of the element, and top part represent the variable costs. The two parts together represent the total cost. As the activity increase, the total cost increase, but only because of the variable costs fluctuations.
The total cost on activity zero will be still the fixed costs, because even if there is nothing happening, the business will still pay the rent, salaries and so on.
If we add to the graph revenue over the range of volume of activity, we then obtain a break-even chart.
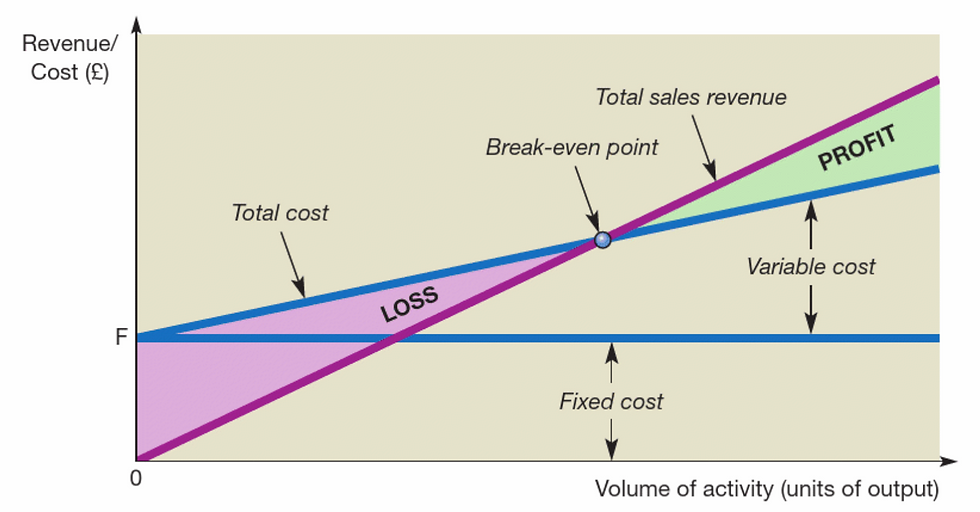
We know that at zero activity, there is zero revenue. When there is no distance between those two lines, the volume of activity is at break-even point. At this point, there is neither profit or loss. If the volume of activity is below the break-even point, a loss will be incurred. It can be rather laborious to calculate the BEP (break-even point) on the graphs. However, if we know that BEP is when Total sales revenue = Total cost, we can expand the formula:
Total sales revenue = Fixed cost + Variable cost
and then:
BEP = Fixed cost / (Sales revenue per unit - variable cost per unit)
For example a company that makes baskets have fixed costs of £500. Each basket requires materials that cost £2 and takes an hour to make. The basket maker gets paid £10 per hour. The baskets are sold for £14.
the BEP would calculate:
BEP = 500/(14 - 12) = 250 baskets per month
Break even point depends on the sales revenue, variable cost and fixed cost. Each of them when changing can significantly affect the BEP.
When calculating BEP we can make judgement of calculating risks. If the volume of activity would just be at the break even point it might be a risky venture.
For example, if the same basket making company predicts to sell 500 baskets per month, but they have an opportunity to rent a basket making machine and the fixed cost per month would increase of £3,000. The labour time would decrease to half an hour per basket. We can calculate how much profit the company would make with the machine and without the machine.
Without the machine With the machine
Sales revenue (500 X £14) £7,000 £7,000
Materials (500 X £2) (£1,000) (£1,000)
Labour (500 X 1 X £10) (£5,000)
(500 X 1/2 X £10) (£2,500)
Fixed cost (£500) (£3,000)
------------------------------ ------------------------------
(£6,500) (£6,500)
Profit £500 £500
The BEP with the machine, would be:
BEP = £ 3,000 / £14 - £7 = 429 baskets per month
The BEP without the machine is 250 baskets per month.
Even if there is no difference in profit, there is a significant difference in BEP. Without the machine the sale could drop to 250 baskets per month before the business fails to make the profit. with the machine reduction in profit could go only 14%.
On the other hand, for each additional basket sold above the estimated £500 the additional profit of £2 would be made without the machine, where £7 would be made with the machine.
Contribution
The bottom part of the break-even formula (sales revenue per unit minus the variable cost per unit) is known as "contribution per unit". So for the basket making activity without the machine would be £2 and with the machine £7. This can be important factor for decision making and it "contributes" to profit.
The contribution marking ratio is the contribution of any activity to the revenue:
Contribution ratio = (Contribution / Sales revenue) X 100%
For the basket making company it would be:
Without the machine (£14-£12/£14) X 100% = 14%
With the machine, (£14-£7/£14) X 100% = 50%
The ratio determines the degree to which the sales revenue is eaten away by various costs.
Margin of safety
The margin of safety is the extend to which the planned volume of outputs, or sales, lines above the BEP.
For the example company:
With the machine Without the machine
Expected volume of sales 500 500
BEP 250 429
Margin of safety 250 71
Expressed in percentage from expected sales 50% 14%
The margin of safety can be used to calculate risk.
Based on the findings, most people would make the decision of not-renting the machine, since the margin of safety is much greater. The risk would be lower without renting the machine.
The margin of safety is directly relating to the selling price of the basket and its variable costs. With the machine the contributions have more fixed costs to "overcome" before the activity becomes profitable.

Operating gearing and its effect on profit
The relationship between fixed profits and variable profits are known as "operating gearing".An activity that has a high fixed cost compared with total variable costs, is said to have high operating gearing. The example company would have high operating gearing using the machine. Renting the machine increases the level of operating gearing as it increases fixed costs. Increasing operating gearing makes profit more sensitive to changes in the volume of activity.
Activities that are capital intensive tend to have high operating gearing and renting or owning capital equipment give raise to additional fixed costs or give raise to lowering variable costs.
Weaknesses of break-even analysis
There are 3 general problems with the analysis:
Break even analysis is generally conducted at the start of the activity, but predicting future costs and revenue can be extremely difficult. Most businesses operate within a narrow range of volume of activity.
Most types of fixed costs are not fixed over the time of activity therefore great care must be taken over the assumptions about the fixed costs. Different activities will have many types of fixed costs.
Most businesses provide more then one product and additional sales of one product may affect another. The same issue arises when trying to identify the fixed costs of the products, thus fixed costs may need to be divided between different products.
Despite the limitations the break-even analysis is widely used.
Marginal analysis
We discussed earlier that when deciding between two or more possible courses of action, only costs that vary should be included in the analysis. In many calculations fixed costs are not relevant because fixed costs cannot be altered in a short term. Whatever the decision, we need to focus on increasing the stakeholders wealth.
With marginal analysis only revenues and costs that vary would be considered. Marginal analysis is generally applied to minor alterations and the variable cost per unit will equal the marginal cost. Marginal analysis can be used for:
* pricing/assessing opportunities to enter contracts;
* determining the most efficient use of resources;
* make-or-buy decisions;
* closing or continuation decisions.
Pricing/assessing opportunities to enter contracts
If, for example, the basket making company have been offered an order of 300 baskets for £13. Should this be profitable?
We know that fixed costs are not relevant to this decision. What we need to see is whether the price offered yields the contribution. If it does, the business will benefit from accepting the contract.
Additional revenue per unit - £13
Additional cost per unit - £12
Additional contribution per unit - £1
So, for 300 units the additional contribution would be £300 so the business will benefit from the contract. However there are other considerations that the business would have to consider:
* there may be another potential customer who offers higher price;
* selling the same product at different price may result in loss of the customer goodwill;
* if the business is unable to make revenues it might need to reduce its capacity instead of running production on reduced sale price;
* the business may see opportunity to breaking into a different market.
Determining the most efficient use of resources
Business wants to determine customer demand for particular goods or services. But output may be restricted by the productive capacity of the business. Business may experience shortage of labour, raw materials, space, machine capacity and so on. Management must then decide on how to best deploy those scare resources. It must decide which products should be produced and how many. Marginal analysis can be useful here. The rule would be that the most profitable combination of products will occur when the contribution per unit is maximised.
The business ability to provide different products or services will be limited by different factors, for example labour that needs to be skilled.
For example we have a company that provides different services:
Service A B C
Selling price per unit £50 £40 £65
Variable cost per unit (£25) (£30) (£35)
Contribution per unit 25 20 30
Labour time per unit 5 hours 3 hours 6 hours
The most profitable service is B as it generates a contribution of £6.67 (£20/3) per hour. The other generate only £5 each.
Generally a first reaction would be that the business should only provide service C because it has the higher contribution per unit, but it would of been a mistake. We can take a random sample of working hours and ask ourselves what is the highest contribution.
Businesses can also make decisions to obtain higher levels of contribution, for example acquiring machine, subcontracting to another business or working shifts, or even redesigning the product so that is requires less labour hours. Some businesses may want to increase the selling price of the product.
Make-or-buy decisions
Business often need to decide whether to produce a service by themselves or buy it from elsewhere. If a business can produce a component internally cheaper and has the capacity to make it, it should decide to make in internally. Sometimes capacity issues occur and getting increased capacity will reduce the contribution internally to the point when it is not profitable and outsourcing would be more beneficial.
There are two major factors to consider when making "make-to-buy" decision. These is generally loss of the control of quality for subcontracted work and potential unreliability of supply. However, sometimes the expertise required for other products may be required if we do not want to outsource work as businesses want to generally focus on their core competencies. It might be possible for businesses to do virtually everything in-house, but it might require skills and facilities that business may not want to acquire.
Closing or continuation decisions
Through marginal analysis we can find some departments underperforming.
For example a store operates in three different departments: Sport equipment, Sport clothes and General clothes.
Total Sport equipment Sport clothes General clothes
Revenue £534 £254 £183 £97
Cost (£482) (£213) (£163) (£106)
Profit/loss £52 £41 £20 (£9)
If the General clothes department was closed the benefit would profit £9 per year.
But we can further divide the fixed and variable costs.
Total Sport equipment Sport clothes General clothes
Revenue £534 £254 £183 £97
Variable costs (£344) (£167) (£117) (£60)
Contribution £190 £87 £66 £37
Fixed costs (£138) (£46) (£46) (£46)
Profit/loss £52 £41 £20 (£9)
Now it appears that closing the General clothes department would make the business worse of £37 - the contribution. The department should not be closed as it makes a positive contribution. As we can see the division between fixed and variable costs and defining the contribution is making the picture much clearer. The general clothing department should not be closed without developments. This could be expansion of other departments or replacing general clothes department with new activity. The business could also sublet the General closing department's space, but it would need to generate rent higher then £37.Or simply keeping the department opened.
Bibliography
P. Atrill, "Accounting and Finance for Non-specialists", 2018, Pearson education, Chapter 7


Comments